This is more than in all of 2025. MDASH is Microsoft Security's multi-model agentic scanning harness that now scans Windows code at greater scale.
Microsoft Source: Microsoft news post, published Nov 20, 2026
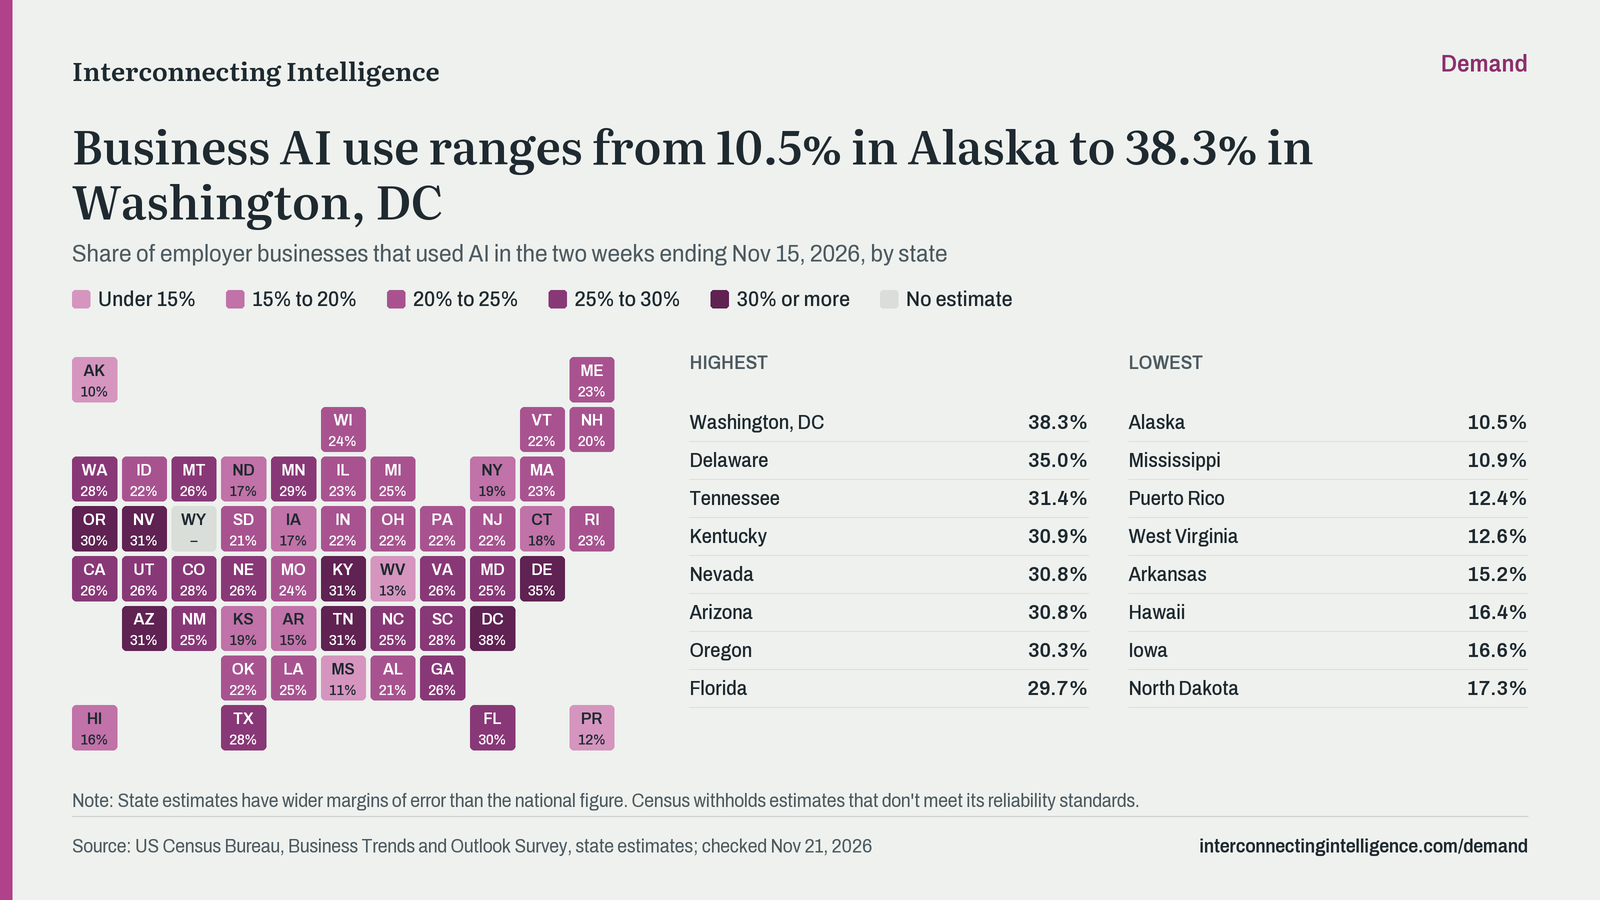
Business AI use ranges from 10.5% in Alaska to 38.3% in Washington, DC.
Updates: every 2 weeks · Last checked Nov 21, 2026
| State | Using AI |
|---|---|
| Washington, DC | 38.3% |
| Delaware | 35.0% |
| Tennessee | 31.4% |
| Kentucky | 30.9% |
| Nevada | 30.8% |
| Arizona | 30.8% |
| Oregon | 30.3% |
| Florida | 29.7% |
| Minnesota | 28.8% |
| South Carolina | 28.5% |
| Washington | 28.3% |
| Colorado | 28.2% |
| Texas | 27.8% |
| Virginia | 26.2% |
| California | 26.2% |
| Nebraska | 26.1% |
| Montana | 25.9% |
| Georgia | 25.8% |
| Utah | 25.7% |
| North Carolina | 25.4% |
| Maryland | 25.3% |
| New Mexico | 25.0% |
| Michigan | 24.8% |
| Louisiana | 24.7% |
| Wisconsin | 23.7% |
| Missouri | 23.5% |
| Rhode Island | 23.3% |
| Illinois | 23.2% |
| Maine | 22.7% |
| Massachusetts | 22.6% |
| Pennsylvania | 22.4% |
| Ohio | 22.1% |
| New Jersey | 22.1% |
| Vermont | 22.0% |
| Indiana | 22.0% |
| Idaho | 21.9% |
| Oklahoma | 21.6% |
| Alabama | 21.4% |
| South Dakota | 21.1% |
| New Hampshire | 20.1% |
| Kansas | 19.3% |
| New York | 18.6% |
| Connecticut | 17.7% |
| North Dakota | 17.3% |
| Iowa | 16.6% |
| Hawaii | 16.4% |
| Arkansas | 15.2% |
| West Virginia | 12.6% |
| Puerto Rico | 12.4% |
| Mississippi | 10.9% |
| Alaska | 10.5% |
| Wyoming | No estimate |
Worked out from the chart's data, as of Nov 21, 2026.
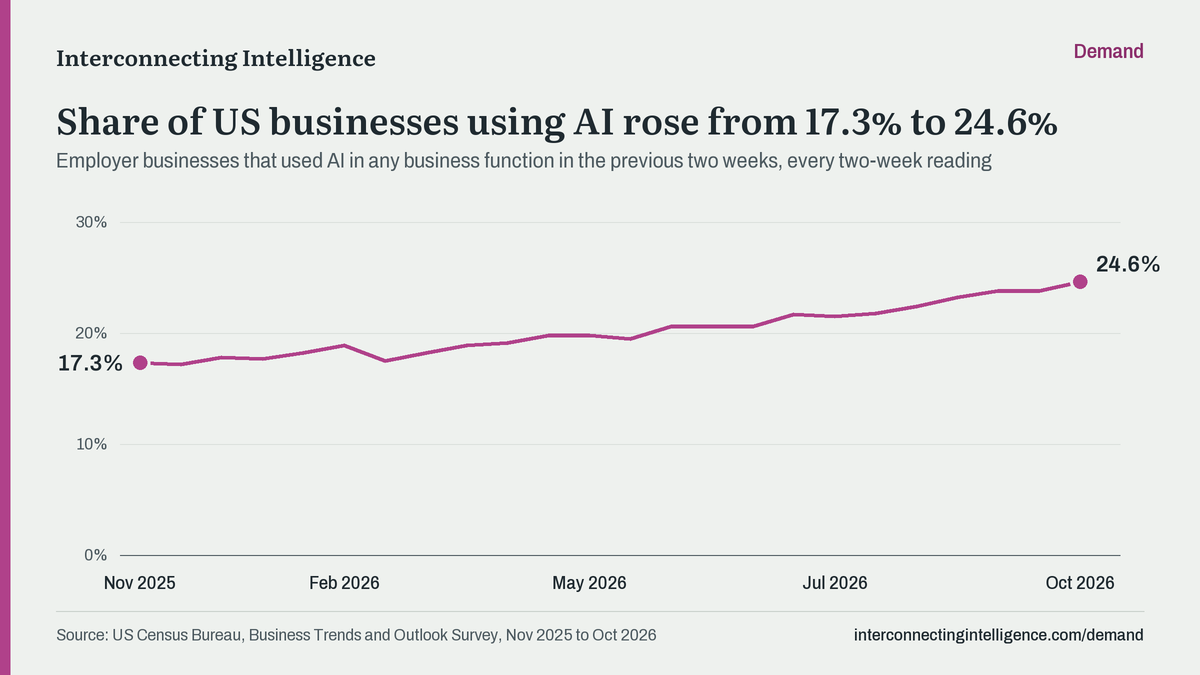
The Census Bureau's Business Trends and Outlook Survey publishes state estimates of the share of employer businesses that used AI in the past two weeks. The map shows the latest two-week period.
State estimates rest on smaller samples than the national figure and have wider margins of error. Census withholds estimates that don't meet its reliability standards, and those states show no value.
On the chart: State estimates have wider margins of error than the national figure. Census withholds estimates that don't meet its reliability standards.
Download as CSV · Free to use with credit to Interconnecting Intelligence and the original source.
| State | Using AI |
|---|---|
| Washington, DC | 38.3% |
| Delaware | 35.0% |
| Tennessee | 31.4% |
| Kentucky | 30.9% |
| Nevada | 30.8% |
| Arizona | 30.8% |
| Oregon | 30.3% |
| Florida | 29.7% |
| Minnesota | 28.8% |
| South Carolina | 28.5% |
| Washington | 28.3% |
| Colorado | 28.2% |
| Texas | 27.8% |
| Virginia | 26.2% |
| California | 26.2% |
| Nebraska | 26.1% |
| Montana | 25.9% |
| Georgia | 25.8% |
| Utah | 25.7% |
| North Carolina | 25.4% |
| Maryland | 25.3% |
| New Mexico | 25.0% |
| Michigan | 24.8% |
| Louisiana | 24.7% |
| Wisconsin | 23.7% |
| Missouri | 23.5% |
| Rhode Island | 23.3% |
| Illinois | 23.2% |
| Maine | 22.7% |
| Massachusetts | 22.6% |
| Pennsylvania | 22.4% |
| Ohio | 22.1% |
| New Jersey | 22.1% |
| Vermont | 22.0% |
| Indiana | 22.0% |
| Idaho | 21.9% |
| Oklahoma | 21.6% |
| Alabama | 21.4% |
| South Dakota | 21.1% |
| New Hampshire | 20.1% |
| Kansas | 19.3% |
| New York | 18.6% |
| Connecticut | 17.7% |
| North Dakota | 17.3% |
| Iowa | 16.6% |
| Hawaii | 16.4% |
| Arkansas | 15.2% |
| West Virginia | 12.6% |
| Puerto Rico | 12.4% |
| Mississippi | 10.9% |
| Alaska | 10.5% |
| Wyoming | No estimate |
This is more than in all of 2025. MDASH is Microsoft Security's multi-model agentic scanning harness that now scans Windows code at greater scale.
Microsoft Source: Microsoft news post, published Nov 20, 2026
Microsoft is building containment, identity and manageability into Windows to run and manage AI agents securely. MXC policies can be set with Intune to control what agents can access.
MetaMicrosoftOpenAI Source: Microsoft news post, published Nov 20, 2026
The team plans to demonstrate a robot that can help a person eat and is experimenting with letting users give instructions in their own words.
University of Pittsburgh Source: Meta news post, published Nov 20, 2026
ATLAS is built on Lean, an open source language for writing mathematics that lets computers verify each logical step. It was presented at the summit as a shared foundation for researchers.
The project was launched with the Rothschild Hospital Foundation and the University of Montreal. It funds researchers to collect de-identified brain data and share it openly.
MetaRothschild Hospital FoundationUniversity of Montreal Source: Meta news post, published Nov 20, 2026