This is more than in all of 2025. MDASH is Microsoft Security's multi-model agentic scanning harness that now scans Windows code at greater scale.
Microsoft Source: Microsoft news post, published Nov 20, 2026
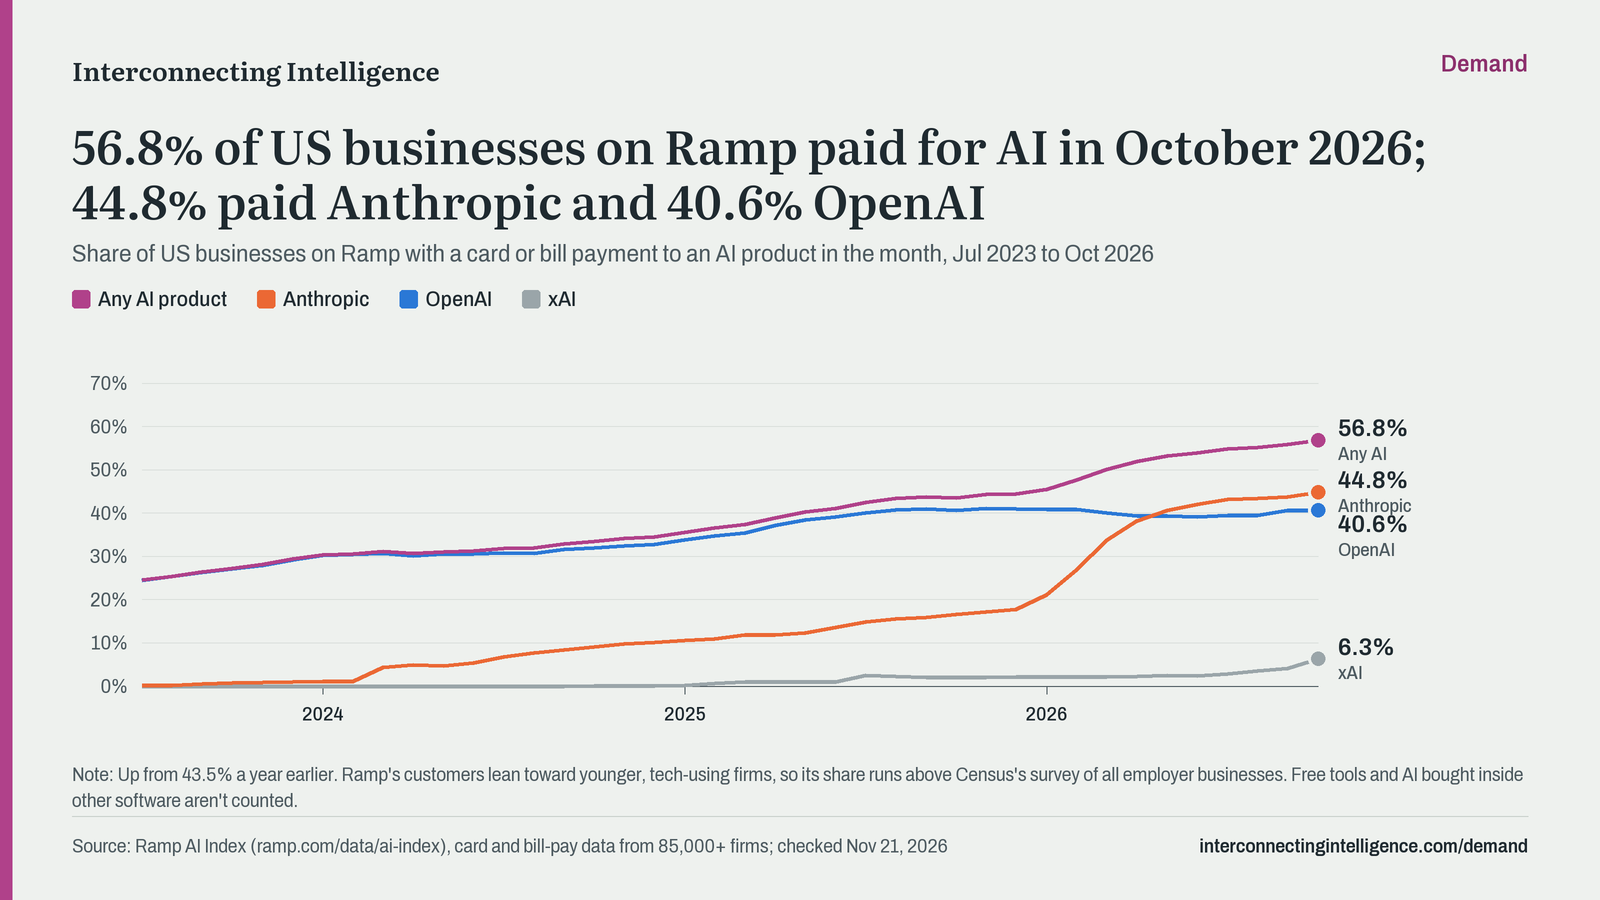
56.8% of US businesses on Ramp paid for AI in October 2026; 44.8% paid Anthropic and 40.6% OpenAI.
Updates: monthly · Last checked Nov 21, 2026
| Month | Any AI product | Anthropic | OpenAI | xAI |
|---|---|---|---|---|
| Oct 2026 | 56.8% | 44.8% | 40.6% | 6.3% |
| Sep 2026 | 55.8% | 43.7% | 40.6% | 4.1% |
| Aug 2026 | 55.2% | 43.4% | 39.5% | 3.5% |
| Jul 2026 | 54.8% | 43.1% | 39.4% | 2.8% |
| Jun 2026 | 53.9% | 42.0% | 39.1% | 2.3% |
| May 2026 | 53.2% | 40.6% | 39.3% | 2.4% |
| Apr 2026 | 51.9% | 38.1% | 39.4% | 2.3% |
| Mar 2026 | 50.1% | 33.6% | 40.0% | 2.2% |
| Feb 2026 | 47.7% | 26.9% | 40.8% | 2.2% |
| Jan 2026 | 45.4% | 21.1% | 40.8% | 2.2% |
| Dec 2025 | 44.4% | 17.8% | 40.9% | 2.1% |
| Nov 2025 | 44.4% | 17.2% | 41.1% | 2.0% |
| Oct 2025 | 43.5% | 16.6% | 40.6% | 2.0% |
| Sep 2025 | 43.7% | 15.9% | 41.0% | 2.0% |
| Aug 2025 | 43.4% | 15.6% | 40.7% | 2.2% |
| Jul 2025 | 42.5% | 14.9% | 40.0% | 2.4% |
| Jun 2025 | 41.1% | 13.6% | 39.1% | 0.9% |
| May 2025 | 40.2% | 12.3% | 38.4% | 1.0% |
| Apr 2025 | 38.9% | 11.8% | 37.1% | 1.0% |
| Mar 2025 | 37.4% | 11.9% | 35.4% | 0.9% |
| Feb 2025 | 36.6% | 11.0% | 34.8% | 0.7% |
| Jan 2025 | 35.5% | 10.6% | 33.7% | 0.1% |
| Dec 2024 | 34.4% | 10.1% | 32.7% | 0.0% |
| Nov 2024 | 34.1% | 9.8% | 32.4% | 0.0% |
| Oct 2024 | 33.5% | 9.1% | 31.9% | 0.1% |
| Sep 2024 | 32.8% | 8.4% | 31.6% | 0.0% |
| Aug 2024 | 32.0% | 7.7% | 30.7% | 0.0% |
| Jul 2024 | 31.8% | 6.8% | 30.7% | 0.0% |
| Jun 2024 | 31.3% | 5.4% | 30.6% | 0.0% |
| May 2024 | 31.1% | 4.7% | 30.5% | 0.0% |
| Apr 2024 | 30.7% | 4.9% | 30.1% | 0.0% |
| Mar 2024 | 31.1% | 4.3% | 30.6% | 0.0% |
| Feb 2024 | 30.6% | 1.1% | 30.4% | 0.0% |
| Jan 2024 | 30.3% | 1.1% | 30.1% | 0.0% |
| Dec 2023 | 29.4% | 1.0% | 29.2% | 0.0% |
| Nov 2023 | 28.1% | 0.8% | 27.9% | 0.0% |
| Oct 2023 | 27.2% | 0.8% | 27.1% | 0.0% |
| Sep 2023 | 26.4% | 0.6% | 26.3% | 0.0% |
| Aug 2023 | 25.3% | 0.2% | 25.3% | 0.0% |
| Jul 2023 | 24.5% | 0.1% | 24.4% | 0.0% |
Worked out from the chart's data, as of Nov 21, 2026.
The Ramp AI Index counts the share of US businesses on Ramp's corporate card and bill-pay platform that paid an AI product or service in a month, overall and by vendor. Ramp says it is built from more than 85,000 businesses' transactions.
It measures paying for AI, not using it: free tools and AI bundled inside other software aren't counted. Ramp's customers lean toward younger, tech-using firms, so its share runs well above the Census survey of all employer businesses. The data refreshes daily from Ramp's published index, which updates monthly.
On the chart: Up from 43.5% a year earlier. Ramp's customers lean toward younger, tech-using firms, so its share runs above Census's survey of all employer businesses. Free tools and AI bought inside other software aren't counted.
Download as CSV · Free to use with credit to Interconnecting Intelligence and the original source.
| Month | Any AI product | Anthropic | OpenAI | xAI |
|---|---|---|---|---|
| Oct 2026 | 56.8% | 44.8% | 40.6% | 6.3% |
| Sep 2026 | 55.8% | 43.7% | 40.6% | 4.1% |
| Aug 2026 | 55.2% | 43.4% | 39.5% | 3.5% |
| Jul 2026 | 54.8% | 43.1% | 39.4% | 2.8% |
| Jun 2026 | 53.9% | 42.0% | 39.1% | 2.3% |
| May 2026 | 53.2% | 40.6% | 39.3% | 2.4% |
| Apr 2026 | 51.9% | 38.1% | 39.4% | 2.3% |
| Mar 2026 | 50.1% | 33.6% | 40.0% | 2.2% |
| Feb 2026 | 47.7% | 26.9% | 40.8% | 2.2% |
| Jan 2026 | 45.4% | 21.1% | 40.8% | 2.2% |
| Dec 2025 | 44.4% | 17.8% | 40.9% | 2.1% |
| Nov 2025 | 44.4% | 17.2% | 41.1% | 2.0% |
| Oct 2025 | 43.5% | 16.6% | 40.6% | 2.0% |
| Sep 2025 | 43.7% | 15.9% | 41.0% | 2.0% |
| Aug 2025 | 43.4% | 15.6% | 40.7% | 2.2% |
| Jul 2025 | 42.5% | 14.9% | 40.0% | 2.4% |
| Jun 2025 | 41.1% | 13.6% | 39.1% | 0.9% |
| May 2025 | 40.2% | 12.3% | 38.4% | 1.0% |
| Apr 2025 | 38.9% | 11.8% | 37.1% | 1.0% |
| Mar 2025 | 37.4% | 11.9% | 35.4% | 0.9% |
| Feb 2025 | 36.6% | 11.0% | 34.8% | 0.7% |
| Jan 2025 | 35.5% | 10.6% | 33.7% | 0.1% |
| Dec 2024 | 34.4% | 10.1% | 32.7% | 0.0% |
| Nov 2024 | 34.1% | 9.8% | 32.4% | 0.0% |
| Oct 2024 | 33.5% | 9.1% | 31.9% | 0.1% |
| Sep 2024 | 32.8% | 8.4% | 31.6% | 0.0% |
| Aug 2024 | 32.0% | 7.7% | 30.7% | 0.0% |
| Jul 2024 | 31.8% | 6.8% | 30.7% | 0.0% |
| Jun 2024 | 31.3% | 5.4% | 30.6% | 0.0% |
| May 2024 | 31.1% | 4.7% | 30.5% | 0.0% |
| Apr 2024 | 30.7% | 4.9% | 30.1% | 0.0% |
| Mar 2024 | 31.1% | 4.3% | 30.6% | 0.0% |
| Feb 2024 | 30.6% | 1.1% | 30.4% | 0.0% |
| Jan 2024 | 30.3% | 1.1% | 30.1% | 0.0% |
| Dec 2023 | 29.4% | 1.0% | 29.2% | 0.0% |
| Nov 2023 | 28.1% | 0.8% | 27.9% | 0.0% |
| Oct 2023 | 27.2% | 0.8% | 27.1% | 0.0% |
| Sep 2023 | 26.4% | 0.6% | 26.3% | 0.0% |
| Aug 2023 | 25.3% | 0.2% | 25.3% | 0.0% |
| Jul 2023 | 24.5% | 0.1% | 24.4% | 0.0% |
This is more than in all of 2025. MDASH is Microsoft Security's multi-model agentic scanning harness that now scans Windows code at greater scale.
Microsoft Source: Microsoft news post, published Nov 20, 2026
Microsoft is building containment, identity and manageability into Windows to run and manage AI agents securely. MXC policies can be set with Intune to control what agents can access.
MetaMicrosoftOpenAI Source: Microsoft news post, published Nov 20, 2026
The team plans to demonstrate a robot that can help a person eat and is experimenting with letting users give instructions in their own words.
University of Pittsburgh Source: Meta news post, published Nov 20, 2026
ATLAS is built on Lean, an open source language for writing mathematics that lets computers verify each logical step. It was presented at the summit as a shared foundation for researchers.
The project was launched with the Rothschild Hospital Foundation and the University of Montreal. It funds researchers to collect de-identified brain data and share it openly.
MetaRothschild Hospital FoundationUniversity of Montreal Source: Meta news post, published Nov 20, 2026