What powers it: utility load, power deals, generation, grid interconnection and electrical equipment.
5 facts published from 3 filers, latest Nov 3, 2026
How it works
Every AI data center is a large electrical load. The energy layer is where that demand meets generation, the grid and the equipment that connects them, and its build times are measured in years.
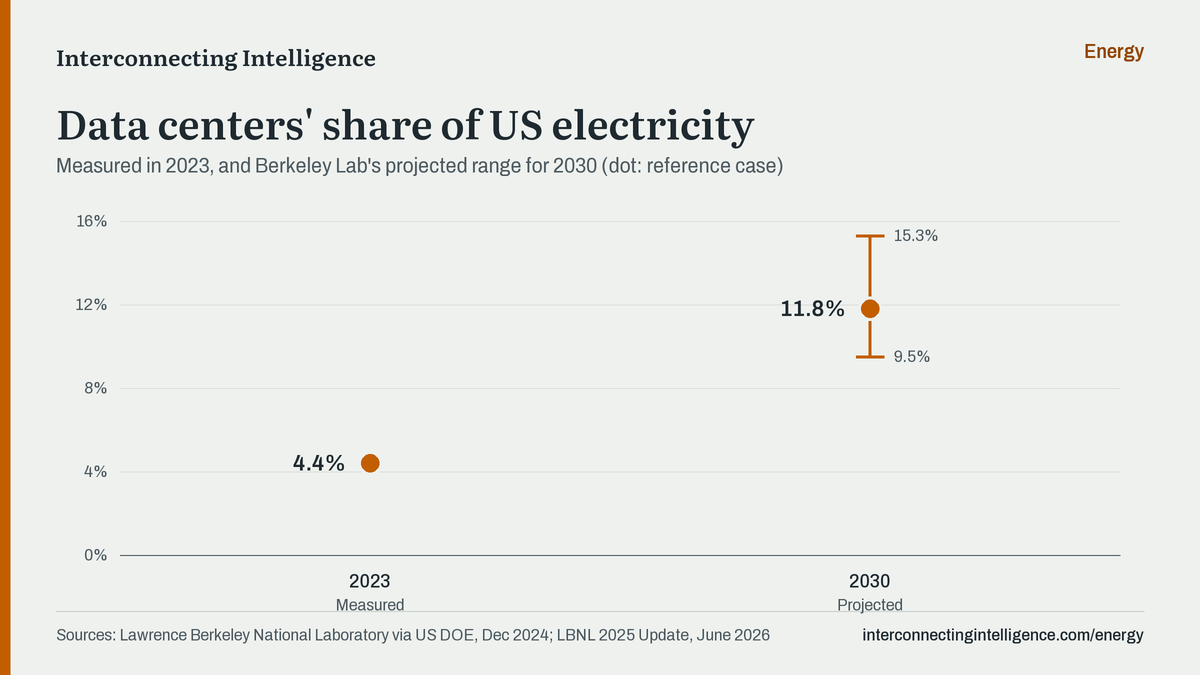
US data centers used about 176 TWh of electricity in 2023, roughly 4.4% of the US total1. Berkeley Lab's 2025 update projects 9.5% to 15.3% by 2030, with 11.8% in its reference case2.
Download imageSized for X and LinkedIn, with source and address included.Show the data
Year
Share of US electricity
2023, measured
4.4%
2030, projected range
9.5% to 15.3%
2030, reference case
11.8%
How a data center gets power
Request. A developer asks the local utility for service. Large requests trigger a load study; AEP Ohio's data center tariff, for example, applies from 25 MW4.
Commitment. The utility agrees to serve the load and reports it as committed load in its disclosures and plans.
Tariff and contract. State regulators set the terms for large loads. AEP Ohio's approved tariff bills data centers for at least 85% of their recent peak demand, under contracts of up to four ramp-up years plus eight more4.
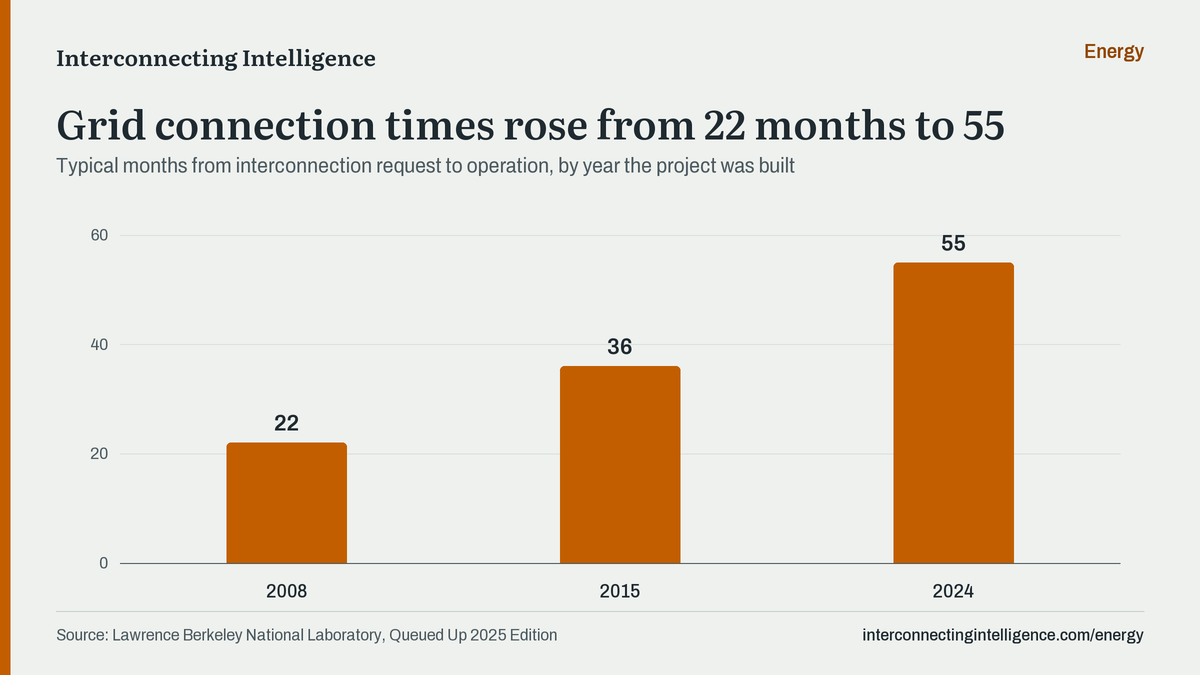
Generation and grid. New power plants wait in interconnection queues. About 2,290 GW of generation and storage was in US queues at the end of 2024, the typical project built in 2024 took 55 months from request to operation, and 13% of capacity requested from 2000 to 2019 had been built3.
Equipment. Turbines and transformers are ordered years ahead. Lead times for new heavy-duty gas turbines at GE Vernova are about three years6, and large power transformers can take as long as four5.
Energization. Substations and lines are completed and service starts, often in phases as the campus fills.
Download imageSized for X and LinkedIn, with source and address included.Show the data
Year built
Months from request to operation
2008
22
2015
36
2024
55
Terms
Committed load
Demand a utility has agreed to serve, usually reported in megawatts or gigawatts.
Large load
A single customer with very high demand, typically tens or hundreds of megawatts.
Large-load tariff
Regulator-approved terms for large customers, often with minimum payments so other customers don't carry the cost if the load never arrives.
Interconnection queue
The line of projects waiting for permission to connect to the grid.
Integrated resource plan
A utility's long-range forecast of demand and the generation it plans to build or buy, filed with its state regulator.
GW and GWh
Gigawatts measure capacity at one moment; gigawatt-hours measure energy used over time.
Largest figures reported
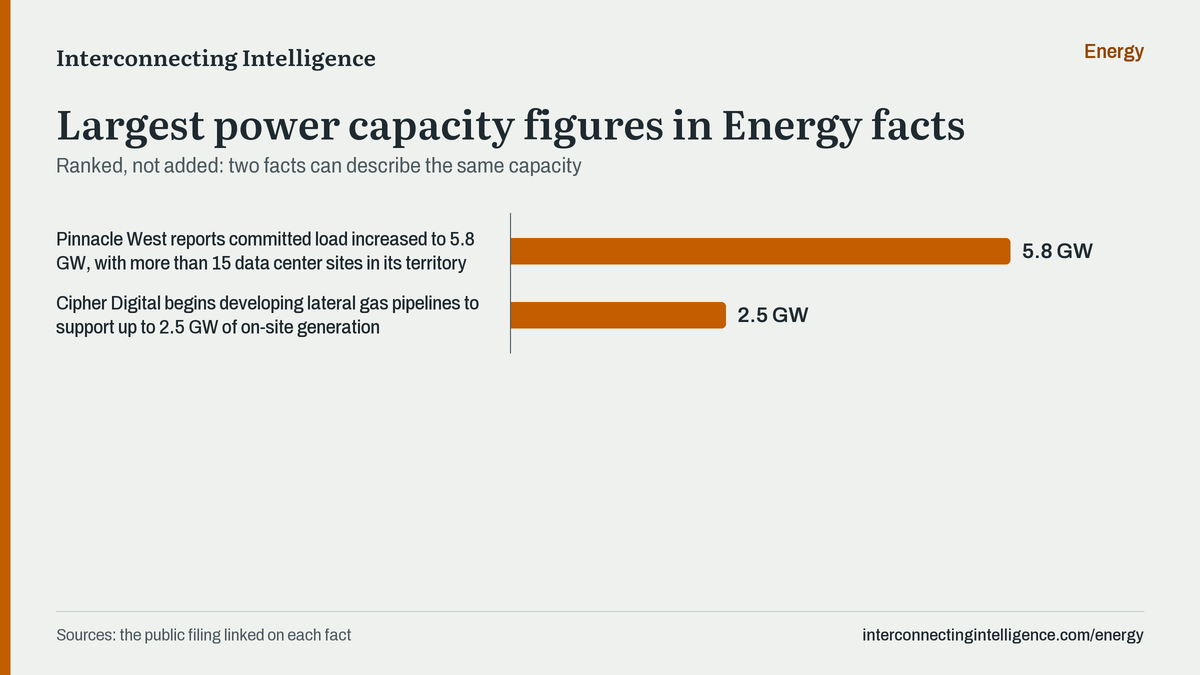
From published facts in this layer, ranked within each kind of measure. They aren't added together, because two facts can describe the same capacity.
Download imageSized for X and LinkedIn, with source and address included.Show the data
Fact
Figure
Pinnacle West reports committed load increased to 5.8 GW, with more than 15 data center sites in its territory
5.8 GW
Cipher Digital begins developing lateral gas pipelines to support up to 2.5 GW of on-site generation
It targets gas availability in 2027, with potential for power generation soon after. Cipher also received ERCOT Batch Zero classifications for Texas pipeline sites, including a base load conditional classification for Colchis (1 GW), with final classifications expected in December.
The definitive agreement was announced November 2, 2026, with closing expected in the first half of 2027. The combined company is to be renamed Nuclea-X Inc. and list on Nasdaq; the release cites data center demand as one driver for Nuclea's technologies.
The Preferred Portfolio identifies ~15 GW of new resources and ~2.6 GW of transmission capacity needed. Manufacturing and data centers are expected to drive the majority of incremental load growth.
Saguaro is slated for 2030 and Desert Sun for 2032. APS also announced up to $440M to convert the retired Cholla plant to 380MWs of natural gas generation by 2029, and is an anchor shipper on a new gas pipeline expected in service by late 2029.
More than 84% of committed load is yet to be served; about 0.9 GW is currently served and about 4.9 GW is not yet served. The manufacturing segment includes semiconductor and advanced packaging, and the data center segment includes more than 15 sites.