The Company says the Hi-C line improves system reliability and operating costs for high power applications in data centers.
ConnectMKeen Labs Source: ConnectM Technology Solutions, Inc. S-1/A, filed Nov 20, 2026
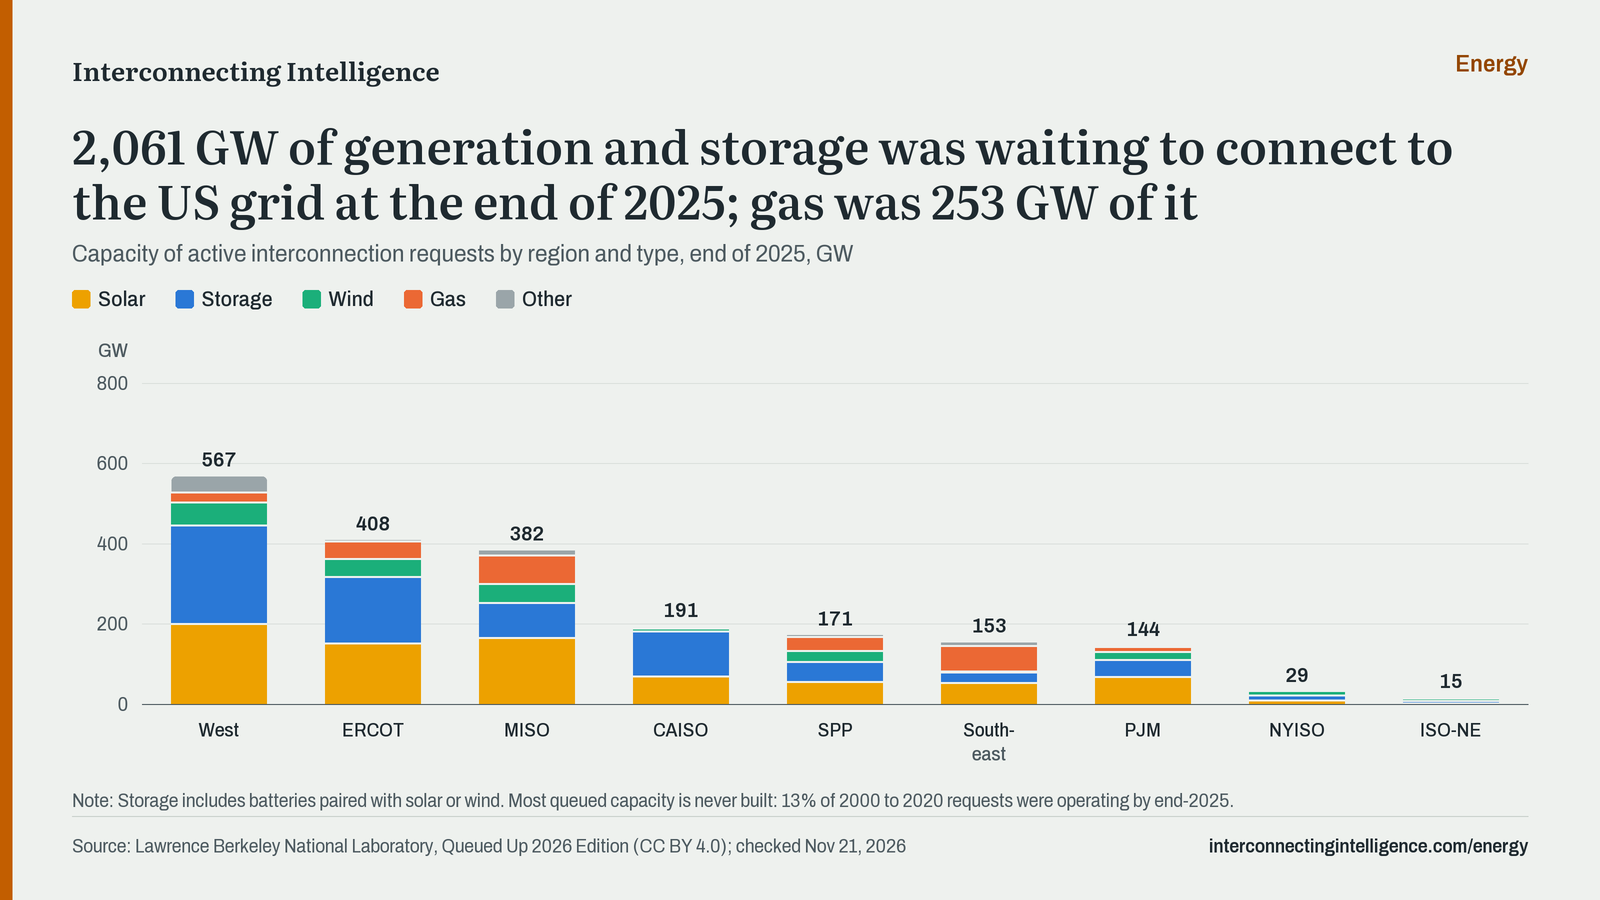
2,061 GW of generation and storage was waiting to connect to the US grid at the end of 2025; gas was 253 GW of it.
Updates: yearly · Last checked Nov 21, 2026
| Region | Solar | Storage | Wind | Gas | Other | Total |
|---|---|---|---|---|---|---|
| West | 200.0 GW | 245.1 GW | 58.0 GW | 24.2 GW | 40.1 GW | 567.4 GW |
| ERCOT | 152.0 GW | 165.3 GW | 44.7 GW | 44.2 GW | 1.8 GW | 408.0 GW |
| MISO | 165.7 GW | 87.1 GW | 46.7 GW | 70.9 GW | 11.8 GW | 382.2 GW |
| CAISO | 69.3 GW | 111.6 GW | 7.7 GW | 2.2 GW | 0.6 GW | 191.4 GW |
| SPP | 54.9 GW | 50.8 GW | 27.3 GW | 35.0 GW | 3.1 GW | 171.1 GW |
| Southeast | 52.6 GW | 26.4 GW | 2.6 GW | 63.5 GW | 7.8 GW | 152.9 GW |
| PJM | 67.8 GW | 42.7 GW | 19.3 GW | 12.7 GW | 1.8 GW | 144.3 GW |
| NYISO | 8.8 GW | 13.2 GW | 7.3 GW | 0.0 GW | 0.0 GW | 29.3 GW |
| ISO-NE | 1.6 GW | 7.1 GW | 6.0 GW | 0.1 GW | 0.0 GW | 14.8 GW |
| All Regions | 772.6 GW | 749.3 GW | 219.7 GW | 252.8 GW | 66.9 GW | 2061.3 GW |
Worked out from the chart's data, as of Nov 21, 2026.
Lawrence Berkeley National Laboratory's Queued Up report compiles the interconnection queues of US grid operators and utilities: projects that have asked to connect, by region and type, at the end of each year.
Most queued capacity is never built; a request is a place in line, not a commitment. The report is licensed under CC BY 4.0 and published yearly.
On the chart: Storage includes batteries paired with solar or wind. Most queued capacity is never built: 13% of 2000 to 2020 requests were operating by end-2025.
Download as CSV · Free to use with credit to Interconnecting Intelligence and the original source.
| Region | Solar | Storage | Wind | Gas | Other | Total |
|---|---|---|---|---|---|---|
| West | 200.0 GW | 245.1 GW | 58.0 GW | 24.2 GW | 40.1 GW | 567.4 GW |
| ERCOT | 152.0 GW | 165.3 GW | 44.7 GW | 44.2 GW | 1.8 GW | 408.0 GW |
| MISO | 165.7 GW | 87.1 GW | 46.7 GW | 70.9 GW | 11.8 GW | 382.2 GW |
| CAISO | 69.3 GW | 111.6 GW | 7.7 GW | 2.2 GW | 0.6 GW | 191.4 GW |
| SPP | 54.9 GW | 50.8 GW | 27.3 GW | 35.0 GW | 3.1 GW | 171.1 GW |
| Southeast | 52.6 GW | 26.4 GW | 2.6 GW | 63.5 GW | 7.8 GW | 152.9 GW |
| PJM | 67.8 GW | 42.7 GW | 19.3 GW | 12.7 GW | 1.8 GW | 144.3 GW |
| NYISO | 8.8 GW | 13.2 GW | 7.3 GW | 0.0 GW | 0.0 GW | 29.3 GW |
| ISO-NE | 1.6 GW | 7.1 GW | 6.0 GW | 0.1 GW | 0.0 GW | 14.8 GW |
| All Regions | 772.6 GW | 749.3 GW | 219.7 GW | 252.8 GW | 66.9 GW | 2061.3 GW |
The Company says the Hi-C line improves system reliability and operating costs for high power applications in data centers.
ConnectMKeen Labs Source: ConnectM Technology Solutions, Inc. S-1/A, filed Nov 20, 2026
2,105.82 acres
Land is owned by third parties and usufruct rights have not been verified. A management screening concluded the regional grid cannot be assumed to support an unconstrained hyperscale connection.
Alpha Digital VoltzAltalab SRL (DR) Source: Alpha Digital Voltz Inc. S-1, filed Nov 20, 2026
The transmission plan is up ~35% vs. the prior 5-year plan within a $38B investment plan; FirstEnergy expects to increase transmission investments by at least 25% vs. the current $19B plan.
FirstEnergy Source: Firstenergy Corp 8-K, filed Nov 20, 2026
The company is also exploring near-term bridge power options and temporary behind-the-meter solutions to support strong West Virginia demand, with an update expected in early 2027.
FirstEnergy Source: Firstenergy Corp 8-K, filed Nov 20, 2026
1,200 MW
Approval also covers 70 MW of utility-scale solar across 3 West Virginia locations; the Maidsville investment of ~$2B is added to the 2026-2030 plan. The order allows contracting with new large load customers, and FirstEnergy is seeking DOE low-cost financing.
FirstEnergyMon PowerPotomac Edison Source: Firstenergy Corp 8-K, filed Nov 20, 2026