The Company says the Hi-C line improves system reliability and operating costs for high power applications in data centers.
ConnectMKeen Labs Source: ConnectM Technology Solutions, Inc. S-1/A, filed Nov 20, 2026
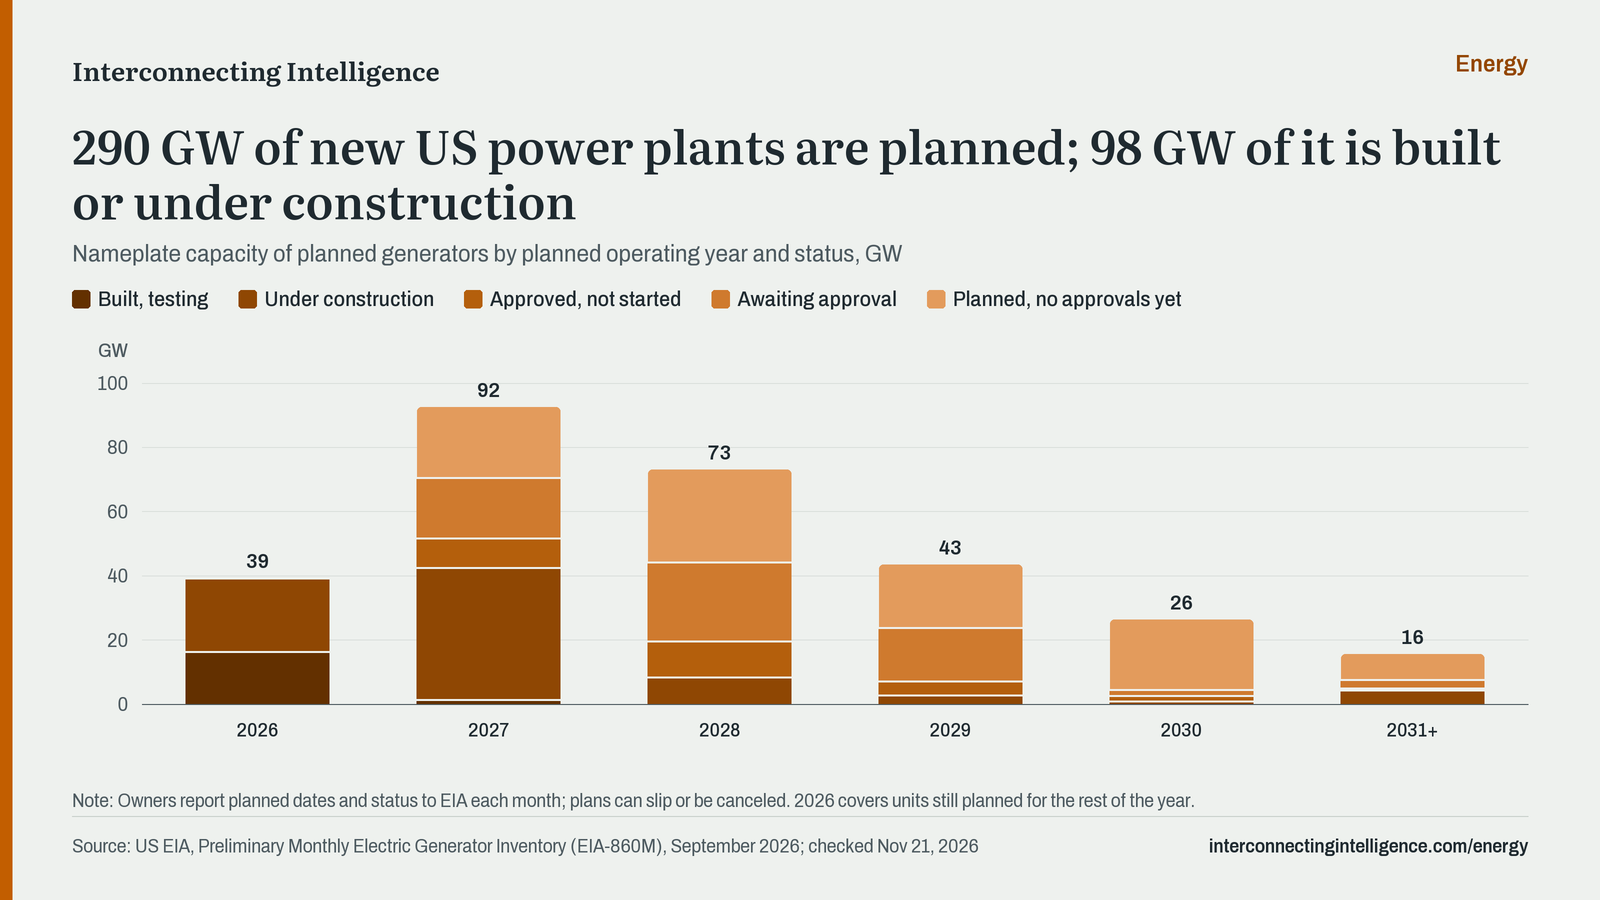
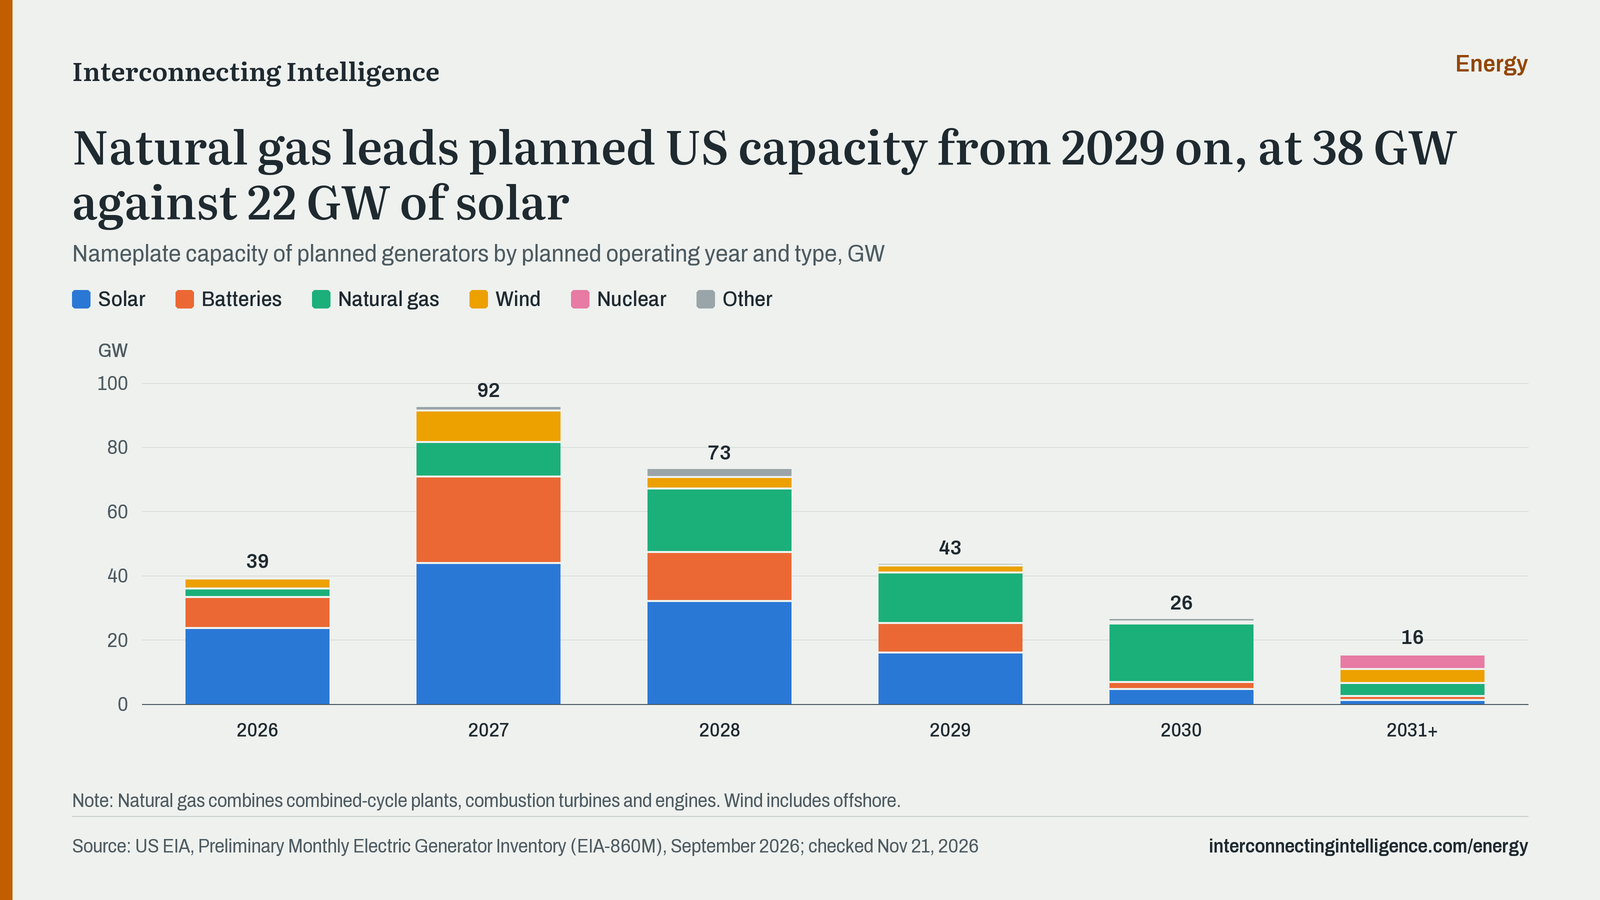
Natural gas leads planned US capacity from 2029 on, at 38 GW against 22 GW of solar.
Updates: monthly · Last checked Nov 21, 2026
| Planned year | Solar | Batteries | Natural gas | Wind | Nuclear | Other |
|---|---|---|---|---|---|---|
| 2026 | 23,693 MW | 9,650 MW | 2,677 MW | 3,194 MW | 0 MW | 37 MW |
| 2027 | 44,052 MW | 26,847 MW | 10,726 MW | 9,899 MW | 0 MW | 975 MW |
| 2028 | 32,219 MW | 15,235 MW | 19,699 MW | 3,656 MW | 0 MW | 2,270 MW |
| 2029 | 16,192 MW | 9,101 MW | 15,748 MW | 2,167 MW | 0 MW | 259 MW |
| 2030 | 4,769 MW | 2,182 MW | 18,134 MW | 247 MW | 500 MW | 567 MW |
| 2031+ | 1,300 MW | 1,219 MW | 4,119 MW | 4,380 MW | 4,468 MW | 62 MW |
Worked out from the chart's data, as of Nov 21, 2026.
The same monthly EIA-860M inventory, grouped by technology. Natural gas combines combined-cycle plants, combustion turbines and engines; wind includes offshore.
Capacity is nameplate capacity, the most a unit can produce, not what it will generate on average. Plans can slip or be canceled.
On the chart: Natural gas combines combined-cycle plants, combustion turbines and engines. Wind includes offshore.
Download as CSV · Free to use with credit to Interconnecting Intelligence and the original source.
| Planned year | Solar | Batteries | Natural gas | Wind | Nuclear | Other |
|---|---|---|---|---|---|---|
| 2026 | 23,693 MW | 9,650 MW | 2,677 MW | 3,194 MW | 0 MW | 37 MW |
| 2027 | 44,052 MW | 26,847 MW | 10,726 MW | 9,899 MW | 0 MW | 975 MW |
| 2028 | 32,219 MW | 15,235 MW | 19,699 MW | 3,656 MW | 0 MW | 2,270 MW |
| 2029 | 16,192 MW | 9,101 MW | 15,748 MW | 2,167 MW | 0 MW | 259 MW |
| 2030 | 4,769 MW | 2,182 MW | 18,134 MW | 247 MW | 500 MW | 567 MW |
| 2031+ | 1,300 MW | 1,219 MW | 4,119 MW | 4,380 MW | 4,468 MW | 62 MW |
The Company says the Hi-C line improves system reliability and operating costs for high power applications in data centers.
ConnectMKeen Labs Source: ConnectM Technology Solutions, Inc. S-1/A, filed Nov 20, 2026
2,105.82 acres
Land is owned by third parties and usufruct rights have not been verified. A management screening concluded the regional grid cannot be assumed to support an unconstrained hyperscale connection.
Alpha Digital VoltzAltalab SRL (DR) Source: Alpha Digital Voltz Inc. S-1, filed Nov 20, 2026
The transmission plan is up ~35% vs. the prior 5-year plan within a $38B investment plan; FirstEnergy expects to increase transmission investments by at least 25% vs. the current $19B plan.
FirstEnergy Source: Firstenergy Corp 8-K, filed Nov 20, 2026
The company is also exploring near-term bridge power options and temporary behind-the-meter solutions to support strong West Virginia demand, with an update expected in early 2027.
FirstEnergy Source: Firstenergy Corp 8-K, filed Nov 20, 2026
1,200 MW
Approval also covers 70 MW of utility-scale solar across 3 West Virginia locations; the Maidsville investment of ~$2B is added to the 2026-2030 plan. The order allows contracting with new large load customers, and FirstEnergy is seeking DOE low-cost financing.
FirstEnergyMon PowerPotomac Edison Source: Firstenergy Corp 8-K, filed Nov 20, 2026