The Company says the Hi-C line improves system reliability and operating costs for high power applications in data centers.
ConnectMKeen Labs Source: ConnectM Technology Solutions, Inc. S-1/A, filed Nov 20, 2026
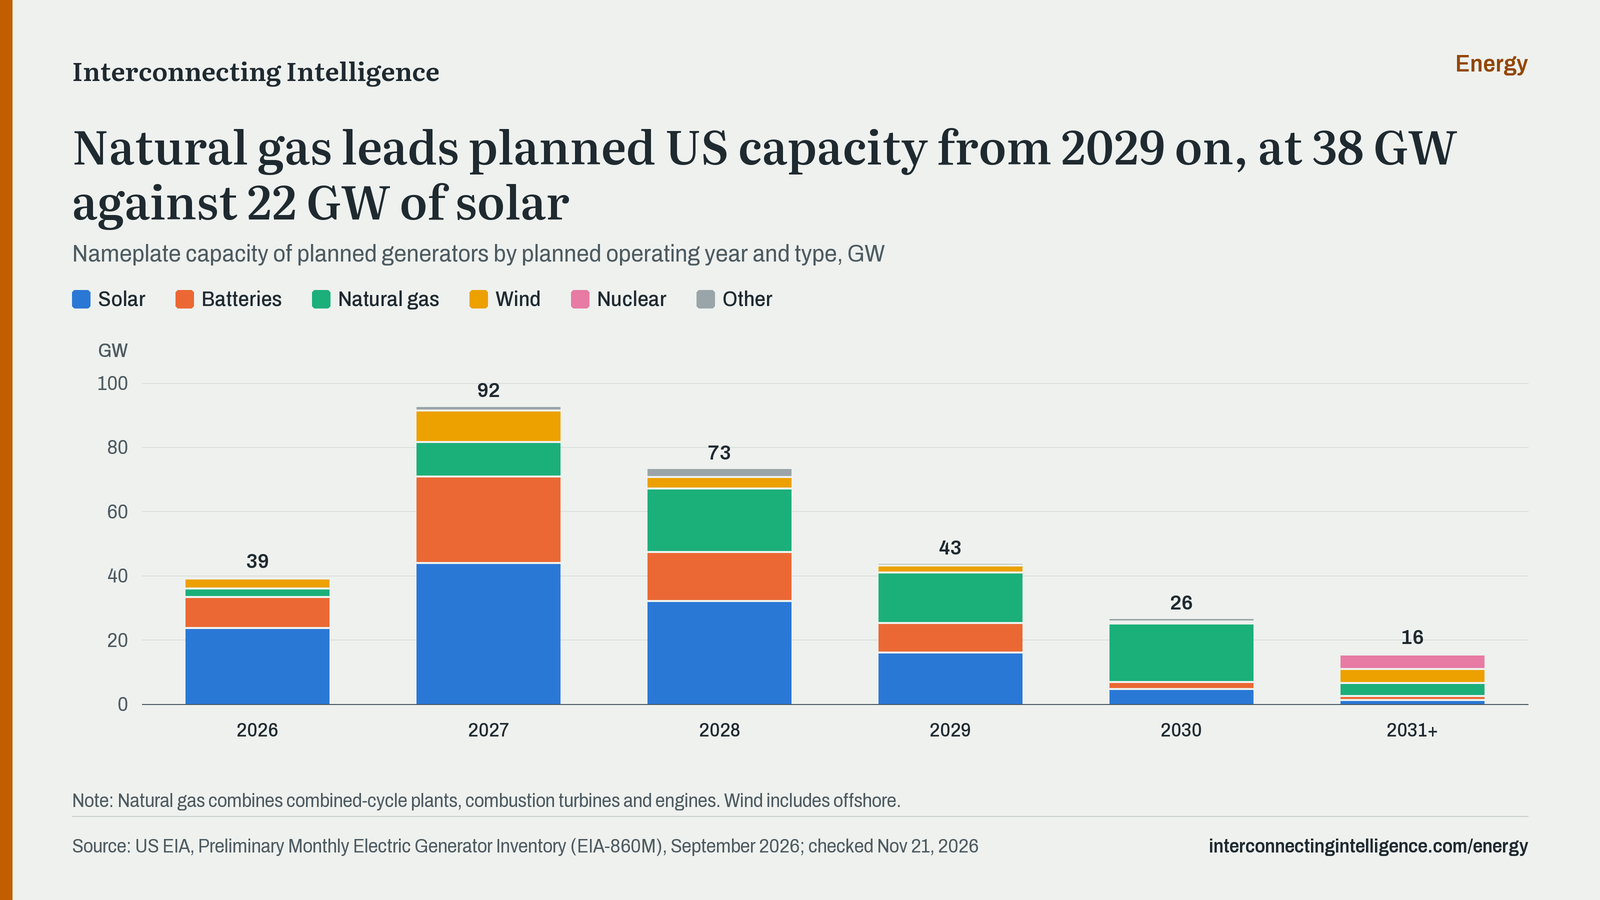
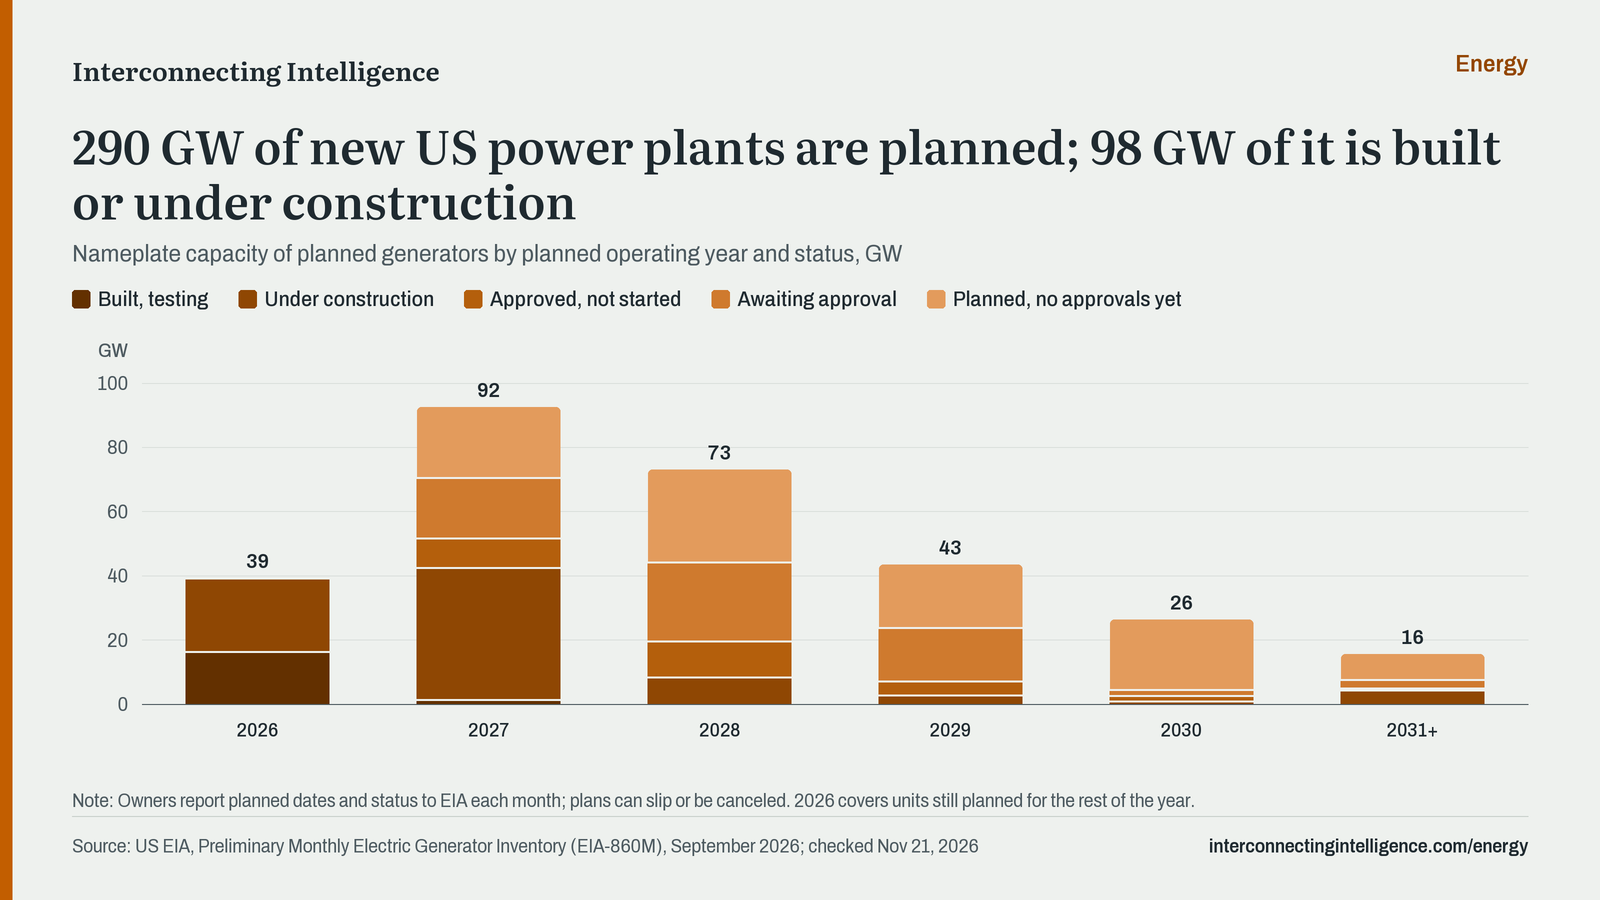
290 GW of new US power plants are planned; 98 GW of it is built or under construction.
Updates: monthly · Last checked Nov 21, 2026
| Planned year | Built, testing | Under construction | Approved, not started | Awaiting approval | Planned, no approvals yet | Total |
|---|---|---|---|---|---|---|
| 2026 | 16,312 MW | 22,797 MW | 5 MW | 130 MW | 7 MW | 39,251 MW |
| 2027 | 1,388 MW | 41,037 MW | 9,231 MW | 18,785 MW | 22,058 MW | 92,499 MW |
| 2028 | 0 MW | 8,339 MW | 11,218 MW | 24,656 MW | 28,866 MW | 73,079 MW |
| 2029 | 0 MW | 2,782 MW | 4,374 MW | 16,643 MW | 19,667 MW | 43,466 MW |
| 2030 | 0 MW | 917 MW | 1,709 MW | 1,763 MW | 22,011 MW | 26,400 MW |
| 2031+ | 0 MW | 4,349 MW | 500 MW | 2,751 MW | 7,948 MW | 15,548 MW |
Worked out from the chart's data, as of Nov 21, 2026.
Owners of power plants report planned generators to the US Energy Information Administration each month (form EIA-860M), with each unit's capacity, planned operating year and status, from built and testing to planned with no approvals yet.
Plans can slip or be canceled, and planned dates are the owners' own. The data refreshes when EIA publishes each month.
On the chart: Owners report planned dates and status to EIA each month; plans can slip or be canceled. 2026 covers units still planned for the rest of the year.
Download as CSV · Free to use with credit to Interconnecting Intelligence and the original source.
| Planned year | Built, testing | Under construction | Approved, not started | Awaiting approval | Planned, no approvals yet | Total |
|---|---|---|---|---|---|---|
| 2026 | 16,312 MW | 22,797 MW | 5 MW | 130 MW | 7 MW | 39,251 MW |
| 2027 | 1,388 MW | 41,037 MW | 9,231 MW | 18,785 MW | 22,058 MW | 92,499 MW |
| 2028 | 0 MW | 8,339 MW | 11,218 MW | 24,656 MW | 28,866 MW | 73,079 MW |
| 2029 | 0 MW | 2,782 MW | 4,374 MW | 16,643 MW | 19,667 MW | 43,466 MW |
| 2030 | 0 MW | 917 MW | 1,709 MW | 1,763 MW | 22,011 MW | 26,400 MW |
| 2031+ | 0 MW | 4,349 MW | 500 MW | 2,751 MW | 7,948 MW | 15,548 MW |
The Company says the Hi-C line improves system reliability and operating costs for high power applications in data centers.
ConnectMKeen Labs Source: ConnectM Technology Solutions, Inc. S-1/A, filed Nov 20, 2026
2,105.82 acres
Land is owned by third parties and usufruct rights have not been verified. A management screening concluded the regional grid cannot be assumed to support an unconstrained hyperscale connection.
Alpha Digital VoltzAltalab SRL (DR) Source: Alpha Digital Voltz Inc. S-1, filed Nov 20, 2026
The transmission plan is up ~35% vs. the prior 5-year plan within a $38B investment plan; FirstEnergy expects to increase transmission investments by at least 25% vs. the current $19B plan.
FirstEnergy Source: Firstenergy Corp 8-K, filed Nov 20, 2026
The company is also exploring near-term bridge power options and temporary behind-the-meter solutions to support strong West Virginia demand, with an update expected in early 2027.
FirstEnergy Source: Firstenergy Corp 8-K, filed Nov 20, 2026
1,200 MW
Approval also covers 70 MW of utility-scale solar across 3 West Virginia locations; the Maidsville investment of ~$2B is added to the 2026-2030 plan. The order allows contracting with new large load customers, and FirstEnergy is seeking DOE low-cost financing.
FirstEnergyMon PowerPotomac Edison Source: Firstenergy Corp 8-K, filed Nov 20, 2026